2024 Grand Traverse County Real Estate Market Report: Year-End Home Sales Data & Trends

2024 Grand Traverse County Real Estate Market Report: Year-End Home Sales Data & Trends

Looking for the latest 2024 Grand Traverse County real estate market trends? This comprehensive year-end home sales report provides in-depth insights into Traverse City home sales, pricing trends, and real estate market performance. Explore historical sales data, compare pricing changes, and discover what’s driving the Northern Michigan housing market.

2024 Grand Traverse County Home Sales Data & Market Trends

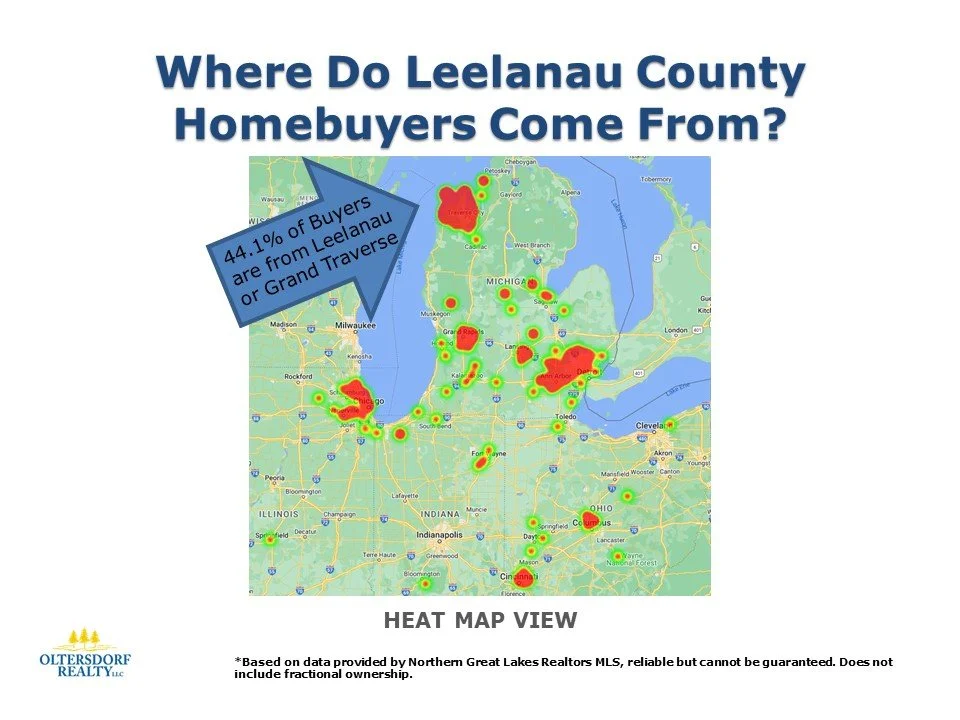
The 2024 real estate market in Grand Traverse County saw notable shifts in pricing and sales volume. Below, we break down the key data points for home sales between January 1, 2024, and December 31, 2024, while comparing trends from the past decade (2015-2023). This data includes sales across Acme, Blair, East Bay, Fife Lake, Garfield, Grant, Green Lake, Long Lake, Mayfield, Paradise, Peninsula, Union, Whitewater, and the City of Traverse City.

Key 2024 Grand Traverse County Home Sales Statistics:

  • Total Homes Sold: +0.38% Increase (compared to 2023)

  • Total Sales Volume: +6.04% Increase

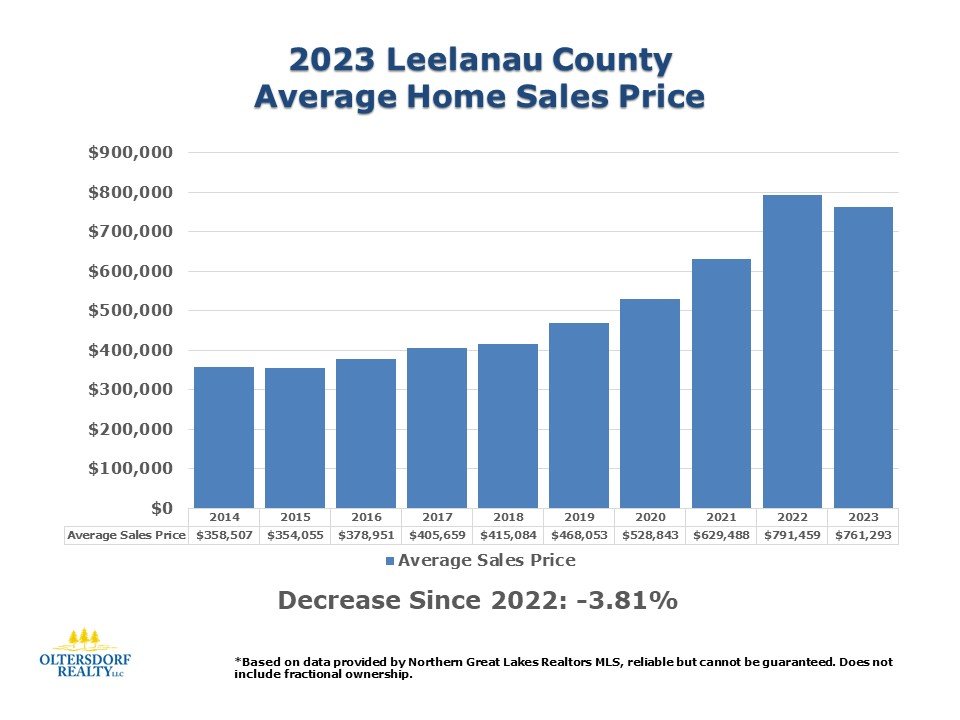
  • Average Home Sales Price: +5.64% Increase

  • Median Home Sales Price: +6.04% Increase

Traverse City & Grand Traverse County Housing Market Insights

The Traverse City real estate market has remained strong, with steady growth in home values and increased buyer demand. Rising home prices in 2024 reflect market stability, while inventory levels continue to shape the housing landscape. Whether you’re a homebuyer, seller, or investor, understanding these real estate market trends is crucial for making informed decisions.

Historical Real Estate Market Comparison: 2015-2024

This Grand Traverse County housing market analysis includes data from the Northern Michigan Realtors MLS spanning 2004-2024. By comparing Traverse City real estate trends over the past decade, you can identify long-term growth patterns and market fluctuations.

Why This Data Matters for Homebuyers & Sellers

  • Sellers: Learn how rising home values can maximize your home sale profits.

  • Buyers: Understand market pricing trends to make informed home purchasing decisions.

  • Investors: Gain insight into Grand Traverse County real estate appreciation rates for better investment strategies.

Reliable Grand Traverse County Home Sales Data

This report is based on verified MLS data from the Northern Michigan Realtors. Note that undisclosed home sales and fractional ownership transactions are excluded to maintain data accuracy.

Need Expert Real Estate Advice? Contact Jonathan Oltersdorf Today!

For personalized insights into Grand Traverse County real estate, reach out to Jonathan Oltersdorf at Oltersdorf Realty, LLC.

📞 Phone: 231-271-7777
📧 Email: jonathan@oltersdorf.com
🌐 Website: www.oltersdorf.com

Leelanau County Real Estate vs. S&P 500: (2006-2024)

Leelanau County Real Estate vs. S&P 500: A Data-Driven Market Comparison (2006-2024)

Are you wondering how Leelanau County real estate compares to the S&P 500 over time? Understanding the performance of home values in Leelanau County versus the stock market can provide valuable insights for investors and homeowners alike.

Our in-depth analysis examines the annual average and median home sale prices in Leelanau County from 2006 to 2024, alongside the S&P 500 year-end closing prices for each corresponding year. By analyzing this data, you'll discover key real estate trends and how they correlate with broader market movements.

Over the past two decades, both real estate and stock market investments have experienced significant appreciation. As economic conditions fluctuate, understanding the relationship between home values and equity markets can help you make informed decisions about buying or selling property in Leelanau County.

📊 Check out the chart above for a side-by-side comparison of Leelanau County home prices and the S&P 500 from 2006 to 2024.

For expert insights into Leelanau County’s housing market trends, contact us today! Whether you're considering a vacation home, investment property, or primary residence, staying informed is key to making the best real estate decisions.

2024 Leelanau County Year-End Vacant Land Sales Data

2024 Leelanau County Vacant Land Market Trends: Year-End Insights

Units Sold: +17.26%
Volume Sold: +17.57%

Introduction:

Explore the latest trends shaping Leelanau County's vacant land market with our comprehensive analysis of the 2024 year-end sales data. This detailed report highlights key statistics such as units and volume sold, current inventory levels, and provides actionable insights into the real estate landscape in Leelanau County. Whether you're a buyer, seller, or investor, this article is your go-to resource for understanding the dynamics of Leelanau County's vacant land market.

Overview:

This analysis covers vacant land sales data from January 1 to December 31, 2024, offering a year-over-year comparison with statistics from 2015 to 2024. Our data spans the entire county, including popular areas like Bingham, Centerville, Cleveland, Elmwood, Empire, Glen Arbor, Kasson, Leelanau, Leland, Solon, Suttons Bay, and the City of Traverse City, located in the southeast corner of Leelanau County.

Key Market Trends:

  • Vacant Land Sales Normalization: After a record-breaking year in 2021, the vacant land market in 2022-2024 saw a return to historical averages.

  • Construction Activity on the Rise: Building permits issued in 2024 showed an uptick, both in volume and total value. While new construction remains expensive, the increased activity signals a more stable construction industry in Leelanau County.

Building Permits and Construction Trends:

Leelanau County experienced a significant increase in building permits issued during 2024, along with a rise in their total value. This growth reflects a stabilization in the construction sector despite the ongoing high costs of new builds. The upward trend is a promising indicator for future development and investment opportunities in the area.

Data Source and Accuracy:

The insights in this report are derived from sales data provided by the Northern Great Lakes Realtors MLS. Please note that undisclosed sales are excluded from the analysis to maintain transparency. While every effort has been made to ensure accuracy, this information is intended for general review purposes and is not guaranteed.

Why Stay Updated on Leelanau County Real Estate?

Staying informed on market trends is essential for making smart real estate decisions. Whether you're looking to invest in vacant land, build your dream home, or understand the market dynamics, the data provided in this report offers valuable context for navigating the Leelanau County real estate market in 2024 and beyond.

Contact Information: For further inquiries or to explore real estate opportunities in Leelanau County, feel free to contact Jonathan Oltersdorf of Oltersdorf Realty, LLC at:

Stay informed and make well-informed decisions in the Leelanau County real estate market by following us on social media!

What Did Leelanau County Home Buyers Purchase in 2024?

What Did Leelanau County Home Buyers Purchase in 2024?

Discover the latest insights into Leelanau County's real estate market with key statistics from 2024. Learn about home sales, pricing trends, and the most active townships in the region.

Leelanau County Real Estate Overview

In 2024, Leelanau County experienced a dynamic real estate market, with significant trends defining the housing landscape. Notably, 63.3% of all homes sold in the county exceeded the $500,000 price point, highlighting a strong demand for higher-end properties.

Pricing Trends

The most common price range for home sales in Leelanau County in 2024 was $400,000 to $500,000, reflecting high buyer interest in this bracket. Close behind were the $300,000 to $400,000 and $500,000 to $600,000 ranges, showcasing a diverse inventory that catered to various budgets and preferences.

Top Townships by Real Estate Activity

Several townships stood out for their high volume of residential sales. Here are the most active areas in Leelanau County's real estate market for 2024:

  1. Leland

  2. Elmwood

  3. Glen Arbor

  4. Suttons Bay

  5. Leelanau

Each of these townships saw robust buyer activity, offering unique opportunities for prospective homeowners.

Conclusion

The 2024 Leelanau County real estate market was defined by strong demand across various price ranges and significant activity in key townships. Whether you're exploring pricing trends or identifying areas with the highest sales volume, these insights provide a valuable snapshot of the local housing market.

Stay informed and make confident real estate decisions in Leelanau County by following Oltersdorf Realty on Facebook or Instagram.

This report is based upon sales information obtained from the Northern Great Lakes Realtors MLS. Undisclosed sales and fractional ownership sales are not included in the data. This is for basic review purposes only. All attempts for accuracy have been made but cannot be guaranteed.

Jonathan Oltersdorf, Oltersdorf Realty, LLC
Phone: 231-271-7777
E-mail: jonathan@oltersdorf.com 

Debunking the Myth: Are Leelanau County Principal Residences Turning Into Vacation Rentals?

Debunking the Myth: Are Leelanau County Principal Residences Turning Into Vacation Rentals?

Interestingly, in 2024, less than half of the homes in Leelanau County—just 46%—were primary residences. A common myth I often hear is that everyone is buying year-round primary homes and converting them into vacation rentals. However, the data doesn’t support this claim. In fact, the percentage of primary homes in Leelanau County has remained fairly consistent over the years, hovering between 45% and 47%. It's actually slightly higher now than it was 15 years ago.

On the other hand, it's clear that the total number of vacation rentals in the county has risen significantly. But the data shows these vacation rentals weren’t year-round primary homes being converted into short-term rentals. Instead, they were already second homes, vacation properties, or long-term rentals. Now, their owners are choosing to rent them out short-term while still using them personally.

Jonathan Oltersdorf, Oltersdorf Realty, LLC
Phone: 231-271-7777
E-mail: jonathan@oltersdorf.com 

Where Are Leelanau County Home Buyers Coming From in 2024?

Where Are Leelanau County Home Buyers Coming From in 2024?

Curious about the origins of home buyers in Leelanau County in 2024? We analyzed the data, breaking down the primary mailing addresses (zip codes) of the 338 residential real estate buyers in the area last year. Here’s what we found.

Local Buyers: A Shrinking Share

In 2024, 40% of home buyers came from zip codes in Leelanau County or neighboring Grand Traverse County, which includes Traverse City. However, this percentage has steadily declined since 2014. This shift marks a notable change in the makeup of the local buyer base.

Expanding Reach: Buyers from Across the U.S.

Historically, most Leelanau County buyers originated from areas within a 6-hour drive. But the trend is changing. More buyers are now coming from across the country, especially from western states like Colorado, California, and Texas.

This evolving dynamic signals a growing interest in Leelanau County real estate from a broader national audience, reflecting the area's appeal beyond Michigan’s borders.

Key Takeaways

  • 40% of 2024 buyers were from local zip codes (Leelanau and Grand Traverse Counties).

  • There’s a notable increase in out-of-state buyers, particularly from western states.

  • The trend highlights Leelanau County’s growing popularity as a destination for relocation or investment.

If you’re considering buying or selling property in Leelanau County, understanding these trends can help you make more informed decisions. Want to explore the real estate opportunities here? Contact us today!

Jonathan Oltersdorf, Oltersdorf Realty, LLC
Phone: 231-271-7777
E-mail: jonathan@oltersdorf.com 

2024 Leelanau Home Buyers - Cash or Financing?

In Leelanau County there were 338 residential home sales in 2024. Did they buy with cash or use financing?

In 2024, there were 338 residential home sales throughout Leelanau County. Of these, 44% were cash purchases (no mortgage), a decrease from the record high of 50% cash sales in 2023. By comparison, Grand Traverse County saw 34.3% of homes purchased with cash in 2024, nearly unchanged from 35.0% in 2023. *Fractional ownership sales are excluded from this data.

This report is based upon sales information obtained from the Northern Great Lakes Realtors MLS. Undisclosed sales and fractional ownership sales are not included in the data. This is for basic review purposes only. All attempts for accuracy have been made but cannot be guaranteed.

Jonathan Oltersdorf, Oltersdorf Realty, LLC
Phone: 231-271-7777
E-mail: jonathan@oltersdorf.com 

Leelanau County Home Sales Report 2024: Record Highs, Market Trends, and Key Insights

Leelanau County Home Sales Report 2024
Record Highs, Market Trends, and Key Insights
(click photos below to enlarge)

Discover the latest trends in the Leelanau County real estate market with our comprehensive 2024 Leelanau County Home Sales Report. This detailed analysis covers key metrics like median prices, average sale prices, total sales volume, and units sold. Dive into the data and see how 2024 stacks up against previous years, including 2023, 2022, and earlier.

In the charts above, we present the comprehensive 2024 year-end home sales data (January 1 – December 31) for Leelanau County. This analysis compares real estate housing sales in the county during 2024 to the corresponding periods in 2023, 2022, 2021, 2020, 2019, 2018, 2017, 2016, and 2015, focusing on townships such as Bingham, Centerville, Cleveland, Elmwood, Empire, Glen Arbor, Kasson, Leelanau, Leland, Solon, Suttons Bay, and the City of Traverse City situated in the southeast corner of Leelanau County.

Leelanau County's residential home sales in 2024 continued to break new ground, achieving all-time record highs in median pricing. However, it's noteworthy that the total number of units sold witnessed a slight decline, primarily influenced by low inventory. The key statistics for Leelanau County Home Sales in 2024 are as follows:

  • Average Price: Increased by +9.33%

  • Median Price: Increased by +4.19%

  • Sales Volume: Increased by +2.94%

  • Units Sold: Decreased by -5.85%

This comprehensive report is derived from sales information gathered from the Northern Michigan Realtors MLS spanning the years 2004 to 2024. The data excludes undisclosed sales and fractional ownership, ensuring transparency and accuracy. Please note that this report is intended for basic review purposes, and while every effort has been made for accuracy, it cannot be guaranteed.

For further inquiries or detailed information, feel free to reach out to Jonathan Oltersdorf of Oltersdorf Realty, LLC at 231-271-7777 or via email at jonathan@oltersdorf.com. Stay informed about the dynamic Leelanau County real estate market with our insights and analysis.

Our 2024 Real Estate Sales!

OUR 2024 SALES | Oltersdorf Realty | Vicky & Jonathan Oltersdorf

Cheers to a busy 2024 and here’s to helping more dreams come true in 2025! Time moves too quickly, 2025 is Jonathan’s 18th year as a Realtor and Vicky’s 44th year!!!!!

2024 Home Sales Data - Mid-Year Review

Year-To-Date Market Snapshot --> How is the Leelanau real estate market in 2024? Average sales price is up but the median sales price is flirting with it's first decline since 2009.....

Year-To-Date Market Snapshot --> How is the Grand Traverse County real estate market in 2024? Price growth has slowed this year but all data is still trending up!

2023 Leelanau County Year-End Vacant Land Sales Data

2023 Leelanau County Year-End Vacant Land Sales Data

Units Sold: -39.93%
Volume Sold: -34.92%

(click photos below to enlarge)

Introduction: Discover the latest trends in Leelanau County's vacant land market with our detailed analysis of the 2023 year-end sales data. In this report, we delve into key statistics, including units sold and volume sold, current vacant land inventory levels, and we providing valuable insights into the real estate landscape in Leelanau County.

Overview: The data presented covers the period from January 1 to December 31, 2023, comparing vacant land sales statistics from 2013 to 2023 across various townships, including Bingham, Centerville, Cleveland, Elmwood, Empire, Glen Arbor, Kasson, Leelanau, Leland, Solon, Suttons Bay, and the City of Traverse City in the southeast corner of Leelanau County.

Market Trends: Following a remarkable year in 2021, both 2022 and 2023 witnessed a return to the historical average for vacant land sales. The graphs illustrate a decline in units sold by 39.93% and a decrease in volume sold by 34.92%, reflecting a market correction after the record-setting sales of the previous year.

Building Permits and Construction Trends: Notably, Leelanau County experienced a downturn in building permits issued and their total value in 2023. This reversal can be attributed to the increased costs of construction materials and labor, leading to a slowdown in the demand for new construction projects throughout the county.

Data Source: Our comprehensive report is based on sales information obtained from the Northern Great Lakes Realtors MLS. It is important to note that undisclosed sales are not included in the data, ensuring transparency and accuracy. Please be advised that this information is for basic review purposes only, and while all efforts have been made to ensure accuracy, it cannot be guaranteed.

Contact Information: For further inquiries or to explore real estate opportunities in Leelanau County, feel free to contact Jonathan Oltersdorf of Oltersdorf Realty, LLC at:

Stay informed and make well-informed decisions in the Leelanau County real estate market by following us on social media!

What did Leelanau County Home Buyers Purchase in 2023?

Exploring Leelanau County Real Estate Trends in 2023

Discover the latest insights into Leelanau County's real estate market with a focus on key statistics from 2023. Gain valuable information about home sales, pricing trends, and the most active townships in the region.

In 2023, Leelanau County witnessed a dynamic real estate landscape, with notable trends shaping the housing market. A staggering 62.5% of all homes sold in the county surpassed the $500,000 mark, reflecting a robust market for higher-end properties.

Pricing Dynamics: The predominant price range for home sales in Leelanau County during 2023 was $400,000-$500,000, indicating a significant demand for homes within this bracket. Following closely, the $300,000-$400,000 range also garnered substantial attention, showcasing a diverse range of properties catering to varying budget preferences.

Township Analysis: Among the Leelanau County townships, 2 stood out as the leader in residential real estate sales volume for 2023. Explore the following options and identify the township that experienced the highest real estate activity:

  1. Elmwood

  2. Glen Arbor

  3. Suttons Bay

  4. Leland

  5. Empire

Conclusion: As you delve into the Leelanau County real estate landscape, these insights provide a comprehensive overview of the market dynamics in 2023. Whether you're interested in pricing trends or discovering the most active townships, this information serves as a valuable resource for anyone navigating the local housing market. Stay informed and make well-informed decisions in your real estate endeavors in Leelanau County by following Oltersdorf Realty on Facebook or Instagram.

This report is based upon sales information obtained from the Northern Great Lakes Realtors MLS. Undisclosed sales and fractional ownership sales are not included in the data. This is for basic review purposes only. All attempts for accuracy have been made but cannot be guaranteed.

Jonathan Oltersdorf, Oltersdorf Realty, LLC
Phone: 231-271-7777
E-mail: jonathan@oltersdorf.com 

Analyzing the Origin of 2023 Leelanau County Homebuyers

Analyzing the Origin of 2023 Leelanau County Homebuyers

Wondering about the origin of Leelanau County homebuyers in 2023? We delved into the data, and out of the 357 buyers of residential real estate in Leelanau County that year, we've dissected their locations based on the primary mailing addresses at the time of purchase.

In 2023, a significant 44.1% of buyers hailed from zip codes within Leelanau County or Grand Traverse County (Traverse City). Interestingly, this percentage has shown a consistent decline since 2014, highlighting a shift in the local buyer landscape. Traditionally, our buyers were predominantly from locations within a 6-hour drive. However, the trend is evolving, as depicted in the chart above, showcasing an increasing influx of homebuyers from various areas across the United States, particularly from the western states like Colorado, California, and Texas.

Leelanau County Real Estate Performance vs. S&P 500: A Comprehensive Analysis

Leelanau County Real Estate Performance vs. S&P 500: A Comprehensive Analysis

Curious about how the Leelanau County Housing Market stacks up against the S&P 500 since 2006? Dive into the chart below for a detailed comparison of the annual average and median home sales prices in Leelanau County spanning from 2006 to 2023, juxtaposed with the year-end closing prices of the S&P 500 on December 31 each year. Explore the data and gain insights into Leelanau County's real estate trends.

2023 Leelanau Home Buyers - Cash or Financing?


In Leelanau County there were 357 residential home sales in 2023. Did they buy with cash or use financing?

In Leelanau County there were 357 residential home sales in 2023. 50% of all home purchases in 2023 in Leelanau County were bought with cash, up from 39% in 2022. This compares to Grand Traverse County which saw 35% of the houses bought with cash in 2023, up from 34% in 2022….

This report is based upon sales information obtained from the Northern Great Lakes Realtors MLS. Undisclosed sales and fractional ownership sales are not included in the data. This is for basic review purposes only. All attempts for accuracy have been made but cannot be guaranteed.

Jonathan Oltersdorf, Oltersdorf Realty, LLC
Phone: 231-271-7777
E-mail: jonathan@oltersdorf.com 

2023 Grand Traverse County Year-End Home Sales Data

2023 Grand Traverse County Year-End Home Sales Data
(click photos below to enlarge)

Explore the 2023 Grand Traverse County (Traverse City) home sales data, comparing prices, volumes, and trends with the previous years. Discover insights on median pricing, average sale prices, and the overall real estate market in the region.

Explore the comprehensive 2023 year-end (January 1 – December 31) home sales figures for Grand Traverse County in the charts above. Compare real estate housing sales in the county from January 1, 2023, to December 31, 2023, with the corresponding periods in 2022, 2021, 2020, 2019, 2018, 2017, 2016, 2015, and 2014, covering townships such as Acme, Blair, East Bay, Fife Lake, Garfield, Grant, Green Lake, Long Lake, Mayfield, Paradise, Peninsula, Union, Whitewater, and the City of Traverse City.

Key 2023 Grand Traverse County Home Sales Statistics:

  • Home Sales Units Sold: -10.95% decrease (attributed to a lack of inventory)

  • Volume Sold: -3.44% decrease

  • Average Sales Price: +8.43% increase

  • Median Sales Price: +8.22% increase

This comprehensive report relies on sales data extracted from the Northern Michigan Realtors MLS spanning from 2004 to 2023. Please note that undisclosed sales and fractional ownership details are excluded. The information provided is intended for basic review purposes, with all efforts made for accuracy, though it cannot be guaranteed.

For further inquiries, contact Jonathan Oltersdorf at Oltersdorf Realty, LLC:

Jonathan Oltersdorf, Oltersdorf Realty, LLC
Phone: 231-271-7777
E-mail: jonathan@oltersdorf.com  

Leelanau County Home Sales Report 2023: Record Highs and Trends Revealed

Leelanau County Home Sales Report 2023: Record Highs and Trends Revealed

(click photos below to enlarge)

Explore the 2023 Leelanau County home sales data, comparing prices, volumes, and trends with the previous years. Discover insights on median pricing, average sale prices, and the overall real estate market in the region.

In the charts above, we present the comprehensive 2023 year-end home sales data (January 1 – December 31) for Leelanau County. This analysis compares real estate housing sales in the county during 2023 to the corresponding periods in 2022, 2021, 2020, 2019, 2018, 2017, 2016, 2015, and 2014, focusing on townships such as Bingham, Centerville, Cleveland, Elmwood, Empire, Glen Arbor, Kasson, Leelanau, Leland, Solon, Suttons Bay, and the City of Traverse City situated in the southeast corner of Leelanau County.

Leelanau County's residential home sales in 2023 continued to break new ground, achieving all-time record highs in median pricing. However, it's noteworthy that the average sale price witnessed a slight decline, primarily influenced by a decrease in luxury property sales. The key statistics for Leelanau County Home Sales in 2023 are as follows:

  • Average Price: Decreased by -3.81%

  • Median Price: Increased by +5.84%

  • Sales Volume: Increased by +2.81%

  • Units Sold: Increased by +6.89%

This comprehensive report is derived from sales information gathered from the Northern Michigan Realtors MLS spanning the years 2004 to 2023. The data excludes undisclosed sales and fractional ownership, ensuring transparency and accuracy. Please note that this report is intended for basic review purposes, and while every effort has been made for accuracy, it cannot be guaranteed.

For further inquiries or detailed information, feel free to reach out to Jonathan Oltersdorf of Oltersdorf Realty, LLC at 231-271-7777 or via email at jonathan@oltersdorf.com. Stay informed about the dynamic Leelanau County real estate market with our insights and analysis.

Leelanau Vacant Land Inventory Update - Fall 2023

12/1/2023 Leelanau County Vacant Land Inventory UPDATE! Although home inventory increased a small amount this year, vacant land inventory in Leelanau County remains at it's lowest level in 20+ years with just 120 available parcels on the market compared to 500+ parcels for sale in the summer of 2020 and nearly 1,000 parcels for sale during the summer of 2014!